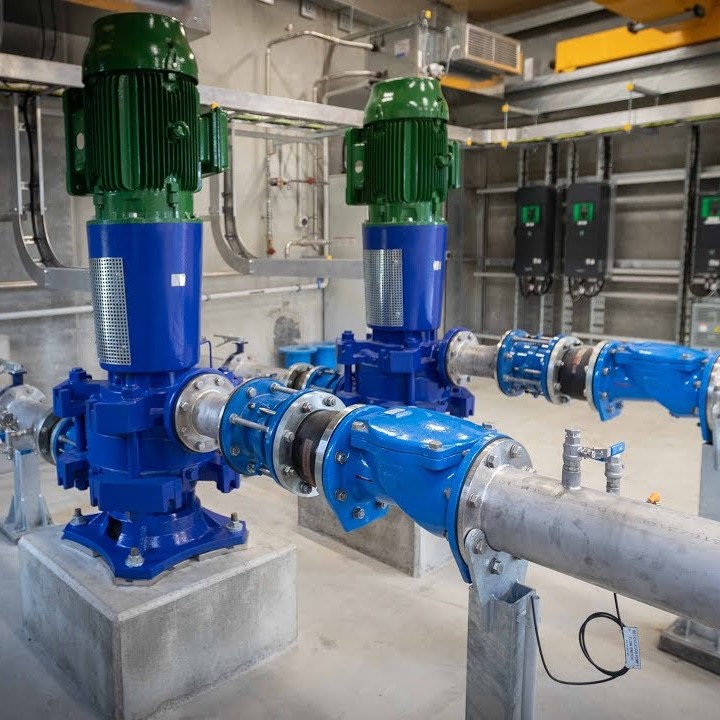
The global pump industry is enormous. According to Oxford Economics, it’s worth an estimated $95 billion and set to grow with a CAGR of 3.6% until 2027. Pumps are an integral part of a large set of industries where movement of fluids is important. Although this list is not exhaustive, these include construction, food and agriculture, chemicals, oil and natural gas, mining, and water treatment and desalination.
The largest sectors for pump usage are agriculture, construction and oil and natural gas extraction. In recent years, however, applications such as water desalination and distribution, and wastewater treatment have seen a rapid rise in the APAC, Middle East and Africa regions. This has, in large part, been driven by an outsized growth in urbanization, creating a higher demand for water in concentrated areas and leading to the construction of new water processing plants.
Considering how these assets are owned and operated, a big component on each asset’s lifecycle is the way it is maintained. There are four main maintenance types, which are:
- Breakdown
- Reactive Maintenance
- Preventive Maintenance
- Predictive Maintenance
Each of the aforementioned maintenance practices come with their own costs. Studies show that the maintenance costs can be calculated in terms of $x per horsepower per pump per year.
Organizations might opt for breakdown or reactive maintenance if the cost of maintenance balances or outweighs the cost of the equipment itself. However, this mentality leads to an increased total cost of ownership in the long-term. Let’s take a look why.
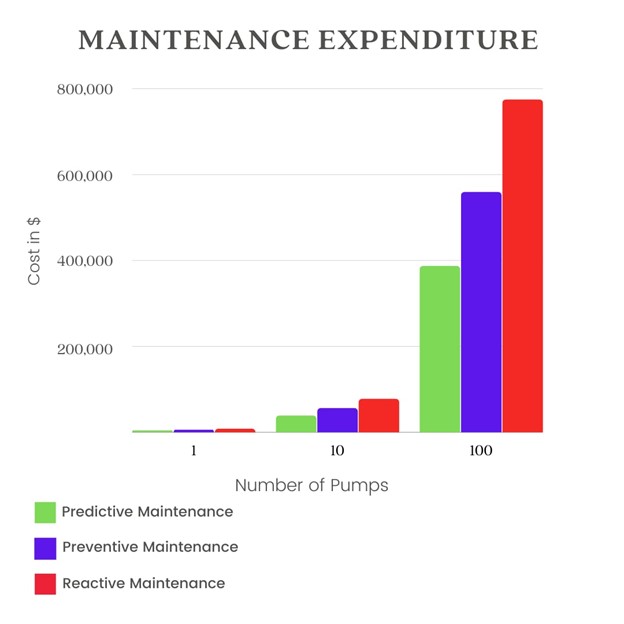
In the figure above, the maintenance costs have been outlined for different maintenance practices. On the high end, reactive or “run to failure” methodologies have an associated cost of $18 per hp. On the other end of the spectrum, predictive maintenance has a cost of $9 per horsepower. Although the $9 difference per hp may not be noticeable in smaller fleet sizes, larger fleets can observe thousands, if not millions, of dollars worth savings just by switching to a different maintenance technique.
As you can clearly see, there are significant savings in maintenance spend when upgrading to more sophisticated methodologies. And, logically, the larger the fleet, the larger the savings. When maintenance teams get insights that allow them to service an asset as soon as a failure is developing, they can avoid the damaging knock-on effects that occur when failures are detected later in the P-F curve, which is what happens with more basic maintenance methodologies. But then, does it not make sense to always implement the most sophisticated maintenance methodology possible? Not always.
That’s because, although the savings by switching to a more advanced type of maintenance methodology increase linearly, the cost of switching to a more cost-efficient (e.g., reactive to preventative) maintenance methodology is not. This means that before considering any of the other gains (e.g. efficiency, productivity, uptime, reduction of HSE risks, etc.), a quick look at the savings in maintenance spend can give a clearer picture as to the base ROI of implementing a more sophisticated maintenance methodology. (To get a complete picture of considerations for calculating your project’s IoT, find our guide here.)
Interestingly, all maintenance methodologies (besides “run to failure”) can stand to benefit by installing sensors which provide real-time, continuous monitoring of their assets. These, at the very least, can provide them with runtime hours of their assets. Or, at the other end of the spectrum, can provide them with the date and type of failure an asset is likely to experience, enabling them to act preemptively before it affects their production.
If you’d like to find out more about how to save on your maintenance spend while making sure your assets hum along, feel free to get in touch or check out our other blogs posts and resources.